RSVP FOR FREE | How Carpe Data Supercharges Roadmap Planning to Deliver Outcomes | Oct 3 @ 9 AM PT

Register

4 Product Prioritization Frameworks & How To Use Them

Due to limited time and resources, every product manager must make difficult trade-off decisions when prioritizing their roadmap. Inspiration for new product features may come from a myriad of sources, and as the list grows, it becomes increasingly challenging to separate the best ideas from the rest. Fortunately, several product prioritization frameworks enable product managers to create customer love and achieve the best business outcomes. 

In this article, we’ll focus on the RICE, MoAR, MoSCow, and Kano frameworks with examples of how to use each. But first, let’s ensure we are speaking the same language.

What is a Product Prioritization Framework, and Why Do You Need One?

A product prioritization framework is a methodology for deciding which product additions and enhancements to tackle, given your goals and constraints. 

Product management prioritization is incredibly challenging because you have multiple stakeholders, and the list of potential projects is endless. The customer comes first, but you must balance requests against your overall product strategy and vision without sacrificing business outcomes. In other words, you want to work on products and features that truly matter to the customers and your business. 

So the great thing about choosing a framework is that it allows you to rise above the noise and make sensible, data-driven decisions based on what will deliver the most value.

There is no “right” product feature prioritization framework. The appropriate one for you depends on your business. The important thing is to find a method your team can align to so you can make confident decisions. So without further ado, let’s dig in. 

The RICE Model

The RICE framework is a simple prioritization model created by the team at Intercom that many product teams have since adopted. It’s calculated as (Reach x Impact x Confidence) / Effort. 

When you prioritize your roadmap with RICE, the key is consistency across the portfolio or against goals.

Let’s break down the different components of the RICE prioritization model:

1. Reach

“Reach” denotes how many people you believe your initiative will touch within a given timeframe of your choice. 

When choosing the Reach value, teams may use the absolute value of x number of customers or a score range between 1-100. We recommend using 1-100.

2. Impact

“Impact” represents a goal to be achieved by this initiative. Initiatives can be anything, including something quantitative, like conversions, or qualitative, like customer satisfaction. 

When choosing the Impact score, use 0-3 to denote the amount. That will represent no, low, medium, and high impacts.

3. Confidence

“Confidence” is chosen based on the assumptions of the idea. It demonstrates whether or not you believe it will deliver on the Reach and Impact. For instance, if you have data to support the Reach score you predicted but no data to support the Impact score, you can reflect this in your Confidence score.

A Confidence score ranges from 1% to 100%. A good practice is to break it down into 50%, 80%, and 100% to represent low, medium, and high confidence. That way, you do not have to spend too much time deciding on a Confidence score.

4. Effort

When you prioritize your roadmap, there will be costs and benefits. As the numerator of the RICE model, “Reach,” “Impact,” and “Confidence” create an idea of your benefits. As the denominator of the RICE model, “Effort” creates an idea of your costs.

“Effort” is often measured in “person-months,” or the number of months it will take one person to complete the task. So if a project will take 1-2 weeks of planning and 2-3 weeks of engineering, we can score it in 2 person-months. This estimate will likely be imprecise, but we recommend keeping the numbers whole for ease of use.

Now Let’s Take a Look at an Example:

If Project 1 has Reach = 50, Impact = 3, Confidence = 80%, and Effort = 12, then the RICE score is 10:

(Reach x Impact x Confidence) / Effort

(50 * 3 * 80%) / 12 = 10

An example of using the RICE product prioritization framework in Dragonboat.
Applying the Rice Model using Dragonboat’s Product Portfolio Management platform

The MoAR Model

The “MoAR” model stands for “Metrics over Available Resources.” Among the different product prioritization frameworks, this one is unique to responsive product portfolio management, replacing the traditional ROI model. 

When you prioritize your roadmap with MoAR, you can directly map to company goals and strategies while also accounting for any urgent resourcing needs.

Let’s Take a Closer Look at What MoAR Means:

What you choose for “Metrics” can vary based on the initiative. Popular “Metrics” are often measures of product benefits such as user growth, referral rate, retention, or net promoter score. These are good ways to gauge future monetary returns, and if your company has adopted goal frameworks like OKRs, you can align these goals with your roadmapping.

“Over Available Resources” refers to the number of resources readily available or the effort needed. Put differently; it considers scarcity. Therefore, you can adjust as needed. 

How to Calculate MoAR

MoAR is calculated as MoAR = Benefit / Effort.

1. Benefit

In this case, “Benefit” demonstrates how much a given initiative contributes towards your organization’s strategic objectives. When using MoAR correctly, these initiatives will be mapped to an objective. Therefore, the Benefit score will prioritize all ideas mapped to that same objective.

When choosing a “Benefit” score, we recommend using a value between 1% to 100%.

2. Effort

Similar to “Effort” in the RICE model, here it refers to an initiative’s cost in terms of resources. Effort is most commonly determined by the estimated weeks needed to complete an initiative by the resource chosen.

Now, Let’s Take a Look at an Example:

Let’s say you are trying to prioritize several features toward a specific goal.

Feature A is expected to contribute 40% of your goal and requires eight weeks of front-end resources. The MoAR for Feature A is 40/8 = 5. 

Feature B is expected to contribute 10% of your goal and requires four weeks of front-end resources. The MoAR for Feature B is 10/4 = 2.5.

Feature C is expected to contribute 20% of your goal and requires five weeks of front-end resources. The MoAR for Feature C is 20/5=4.

You would then compare and prioritize features based on your MoAR scores. 

Feature A > Feature C > Feature B. Therefore, you would cut Feature B even though it takes the least resources. You can then address that Features A and C only make up 60% of your goal by reducing the target by 40% or choosing a new feature to cover the gap.

When you prioritize your roadmap with the MoAR framework, you can be responsive and proactive in addressing gaps. 

An example of using the MoAR product prioritization framework in Dragonboat.
Applying the MoAR Model Using Dragonboat’s Product Portfolio Management Platform

Recommended for you: Effective Feature Prioritization with Product Portfolio Management

The MoSCoW Model

The MoSCoW model is another way to prioritize your roadmap, which primarily focuses on ranking the importance of requirements. Created by Dai Clegg at Oracle, MoSCoW is an acronym for four categories: “Must-Have,” “Should-Have,” Could-Have,” and “Won’t-Have” (at least not in the short term) or alternatively, “Wish-to-Have.” 

To use the framework, it’s first important to be clear on the team’s objectives and factors for prioritization. You will need to devise a way to settle any disputes you may have about which category is best for each feature or initiative. 

Let’s Look Closer at the Four MoSCoW Categories:

Must-Have: These are the product needs that the team absolutely must work on since they are critical to the product’s success. 

Should-Have: These initiatives are not critical but would provide significant business and customer value. 

Could-Have: Once the “Must-Haves” and “Should-Haves” are taken care of, these are the initiatives to prioritize next. They would add value but aren’t absolutely needed.

Won’t-Have: These are the initiatives that the team excludes from the prioritization process. Including items in this category helps to prevent scope creep and keep the team focused. 

Let’s say a team is working on an MVP for a new social media app with a very limited budget and timeline. Here is an example of how it might prioritize its proposed list of features:

Example of prioritizing product features using the MoSCoW method.
Applying the MoSCoW Model Using Dragonboat’s Product Portfolio Management Platform

Any team can apply the MoSCoW model. For example, the QA team could use it to decide which test cases to prioritize in the next sprint. However, there are some potential drawbacks to just using MoSCoW for product prioritization. For instance, it might be susceptible to bias, and scoring could be imprecise due to a lack of the proper inputs to make the right decisions.

The Kano Model

Where the MoSCoW model focuses on the degree to which features are necessary, Kano is one of the product prioritization frameworks emphasizing features that maximize customer satisfaction and delight while weighing their costs. It argues that more is not always better. It also recognizes that some features might even lead to negative customer outcomes. On the other hand, it points out that, over time, features that were once considered a “nice-to-have” become a given.

You can use the Kano model to categorize features based on their predicted customer reaction. For best results, make sure to do some customer research ahead of time in order to bring data to the decision-making process. 

Categories in Kano 

Excitement: Features in this category contribute to the “wow” factor for customers. Using a hotel as an example, excitement features could include offering guests complimentary tours and transportation.

Performance: Also known as “satisfiers,” these are features customers notice and appreciate. Returning to the hotel example, offering free beverages in the room is an added benefit but not necessarily expected. 

Basic: These are the features that your product needs in order to be competitive, yet are so fundamental that customers wouldn’t think to request them. For example, hotel guests would expect to receive a room that has a bed with clean sheets. However, if a hotel fails to provide this feature, it will soon be out of business! 

Indifferent: These are the features that most customers would not have a strong preference for or against. In a hotel, this might be having stairwells in addition to elevators. While most customers might be satisfied with just using the elevator, the hotel owner needs to make sure to have adequate stairwell access in order to comply with fire safety standards. 

Dissatisfaction: These features, if implemented, would cause customers to be less satisfied with the product. For example, a hotel with has a clock tower, while perhaps architecturally pleasing, might wake customers at night and worsen their experience. 

To put this model into practice, first, formulate a simple customer questionnaire that consists of two basic questions regarding each feature:

  1. How would you feel if the product had X feature?
  2. How would you feel if the product lacked X feature?

For the answer options, you can use a Likert scale with five responses (indicating the strength of the respondent’s opinion) that correspond to each question. Based on the answers, you should be able to arrange the feature ideas into the different categories of customer delight.

Product Prioritization Frameworks for Better Decisions

There are other prioritization and product management frameworks using methods like weighted scoring, opportunity scoring, or even user story mapping. And creative options even incorporate the cost of delay or a game-like method where you “buy a feature.” But the four options above should be plenty to get you started on prioritizing your product roadmap. 

For outcome-driven teams, we recommend starting with MoAR since it directly addresses how to prioritize your roadmap by objectives. 

Remember that for every ideal way, there is an equally wrong way to prioritize your product development plans. For instance, is everyone’s opinion heard, or is it only the most vocal team members? Is data involved, or are you working off a hunch? So, be sure to evaluate how your team is making decisions today and be honest if things need to change.

To see how we use product prioritization frameworks in Dragonboat, sign up for a demo today. 

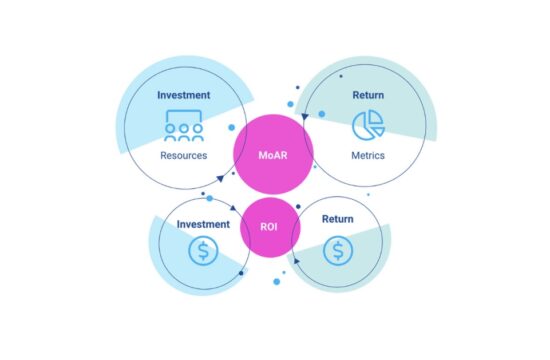
Forget ROI, Use MoAR for Product Portfolio Metrics

Nearly every department has a KPI to measure short-term success. But what about your product team? What one metric measures product’s effectiveness and impact? Return on Investment (ROI) measures monetary value, but there is more to effective product portfolio management than ROI. So, instead, we recommend using Metrics Over Available Resources (MoAR) to directly evaluate opportunities to maximize your product investment and business outcomes.

The Shift From ROI

Portfolio Management is a finance concept that refers to allocating investments across different asset classes (based on the assumed risk and reward) to optimize the overall outcome. Product Portfolio Management (PPM) applies that same approach to your organization, allocating scarce resources to the work that yields the most value.

Years ago, I led strategic planning for PayPal’s product portfolios. We needed to evaluate opportunities that could help the company achieve specific objectives, such as improving engagement, launching into a new market, reducing transaction costs, and taking risks on emerging trends. 

How could we compare these diverse product initiatives across revenue growth, cost reduction, and risky innovation?

We tried using ROI but quickly ran into limitations. It was nearly impossible to clearly and consistently tie initiatives to specific outcomes. We needed a solution to measure and evaluate opportunities more directly than ROI. That led us to develop a new approach – MoAR, or Metrics Over Available Resources.

The Trouble With ROI

Return on Investment (ROI) is a ratio between net profit (over a period) and the investment cost. It is a performance measure often used to evaluate or compare the efficiency of different investments.

ROI works well in traditional industries or functions where benefits and scarce resources can easily be measured in money. But ROI becomes elusive when you need to measure outcomes that are not clearly associated with money or have other forms of scarce resources.

Smart Roadmap Planning with Dragonboat MoAR
Replace ROI with MoAR – plan your portfolio roadmap the modern way

Product Portfolio Metrics: Measuring Benefits

In the world of manufactured goods, measuring a product’s financial impact is relatively straightforward. For instance, we can easily track how much revenue a newly designed cup generates in 1 year and compare that to the costs to calculate its 1-year ROI.

In contrast, a software product consists of many features. We can infer the monetary benefit of a proposed new feature by estimating its relative contribution to a business metric. But it is nearly impossible to directly measure and attribute the financial outcome of individual product features

An Example

Imagine that you are a SaaS provider. Based on experience, you know that increasing sign-up conversions by 5% will result in $100k in quarterly profit if everything else remains unchanged. Feature A aims to increase sign-ups by 2%, so we can infer that launching this feature will result in a $40k bump in profit.

However, although we can measure the change in profit, we cannot attribute the change to a given feature unless we do nothing else to affect sign-up conversions during that time. That isn’t a reasonable expectation for an agile company.

Other complicating factors include the following:

  • Monetary-based benefit measures have a negative bias against innovation and risk-taking. Investing in a cash-cow mature business always generates a higher ROI than developing products, at least initially.
  • Money isn’t the only scarce resource. Sometimes the most limited resource is human capital. If you need software engineers with highly specialized (and in-demand) skills to build the product and achieve your growth metrics, you must factor that into your thought process 

So, What are Metrics Over Available Resources (MoAR)?

Metrics Over Available Resources (“MoAR”) is the ratio of the expected contribution of a product feature towards a measurable business outcome over the number of resources needed to achieve that contribution.

MoAR provides a more direct and holistic measure for portfolio planning and a clearer visual of product portfolio metrics than ROI. Let’s look at MoAR in action to show you what I mean.

Using MoAR for Product Planning

To use MoAR, start with defining the appropriate metrics to measure benefits towards the desired business outcomes or objectives.

  • Metrics such as user growth, referral rate, retention, and Net Promoter Score (NPS), are the direct measure of product benefits. And they are often leading indicators of monetary-based returns. Furthermore, companies that adopt an OKR or V2MOM framework can easily connect outcome targets with product portfolio roadmapping. MoAR enables an outcome-driven portfolio roadmap.
  • Available Resources indicate scarce resources, like Scala Engineers or the UX designer who designed your last app.

During portfolio roadmap planning, compare features that require the same resources using MoAR to prioritize. Then add up the contribution of all planned features toward the goal. The total contribution should be 100% or higher to ensure the goal is achievable based on the current plan. Anything less indicates an outcome or resource gap. 

For example, assume a key business goal for the next quarter is to increase conversion by 10%. Three features are coming to the team, and only 16 weeks of front-end resources are available.

  • Feature A is expected to contribute 40% of this goal and requires eight weeks of front-end resources. The MoAR for Feature A is 40/8 = 5.
  • Feature B may add 20% of this goal and requires eight weeks of front-end resources. The MoAR for Feature B is 20/8 = 2.5.
  • Feature C contributes to a cost-saving metric but not towards the conversion goal. And it requires four weeks of front-end resources. Thus, the MoAR for Feature C is 0.

Using MoAR to Prioritize Conversion-Boosting Features

 Feature AFeature BFeature CTotal
Contribution (%)4020060
Resource needed
(in weeks)
88420
MoAR52.50/

Let’s evaluate these features.

First, the total resource requirement is 20 weeks. We only have 16 weeks available, so we have a shortage of front-end resources to support these three features. We will de-prioritize Feature C as its MoAR is 0.

However, this plan is not ready to go yet because there is an outcome gap – Features A and B will contribute to only 60% of the target metric, so we will not achieve the desired outcome. 

The team needs to either reduce the target outcome by 40% and get stakeholder buy-in or start over to design a different feature set to achieve 100% of the target.

Although this is not what the team hoped to see, the information is vital. Identifying gaps during the planning phase gives the team time to address them before it’s too late.

Metrics Over Available Resources: Key Takeaways

The Metrics over Available Resources (“MoAR”) prioritization method allows companies to readily incorporate a direct measure against goals into their roadmap planning and dynamic alignment process. That enables better product decisions, easily visualized product portfolio metrics, and improved overall outcomes.

MoAR is a key element of Responsive PPM – the new portfolio management approach for outcome-driven organizations. Book a demo today to see MoAR in action.

Responsive PPM CTA

This site uses cookies. Some of these cookies are essential, while others help us to improve your experience by providing insights into how the site is being used. For more information, please check our Privacy Policy. You can disable or remove cookies in your browser settings at any time. By clicking "Accept" or continuing to use this site, you consent to our use of cookies across the site.